
At a glance
- Principals are asking for three numbers: TAM, market share, and whitespace. Whether it's a quarterly review with an existing supplier or a pitch to a new one, the ask is the same. Most distributors can't produce any of them with precision.
- The data exists but lives in silos. ERP transaction history, product technical data, customer industry codes, and market intelligence sit in separate systems with no common thread.
- This blind spot costs you on both sides of the table. You can't defend existing principal relationships or win new ones without quantifying the opportunity.
You know the moment. You're in a quarterly review and your principal asks what share of the addressable market you're capturing in your territory. Or you're courting a new supplier and they want to see how big the opportunity is before they sign a distribution agreement.
Either way, the question is the same. And either way, you're working from an incomplete picture.
You know your revenue per supplier. What you don't know is your penetration rate, your whitespace, or the total opportunity sitting inside your existing customer base. That gap is the principal management blind spot, and it shows up in every important conversation you have with a supplier.
The three numbers that decide principal relationships
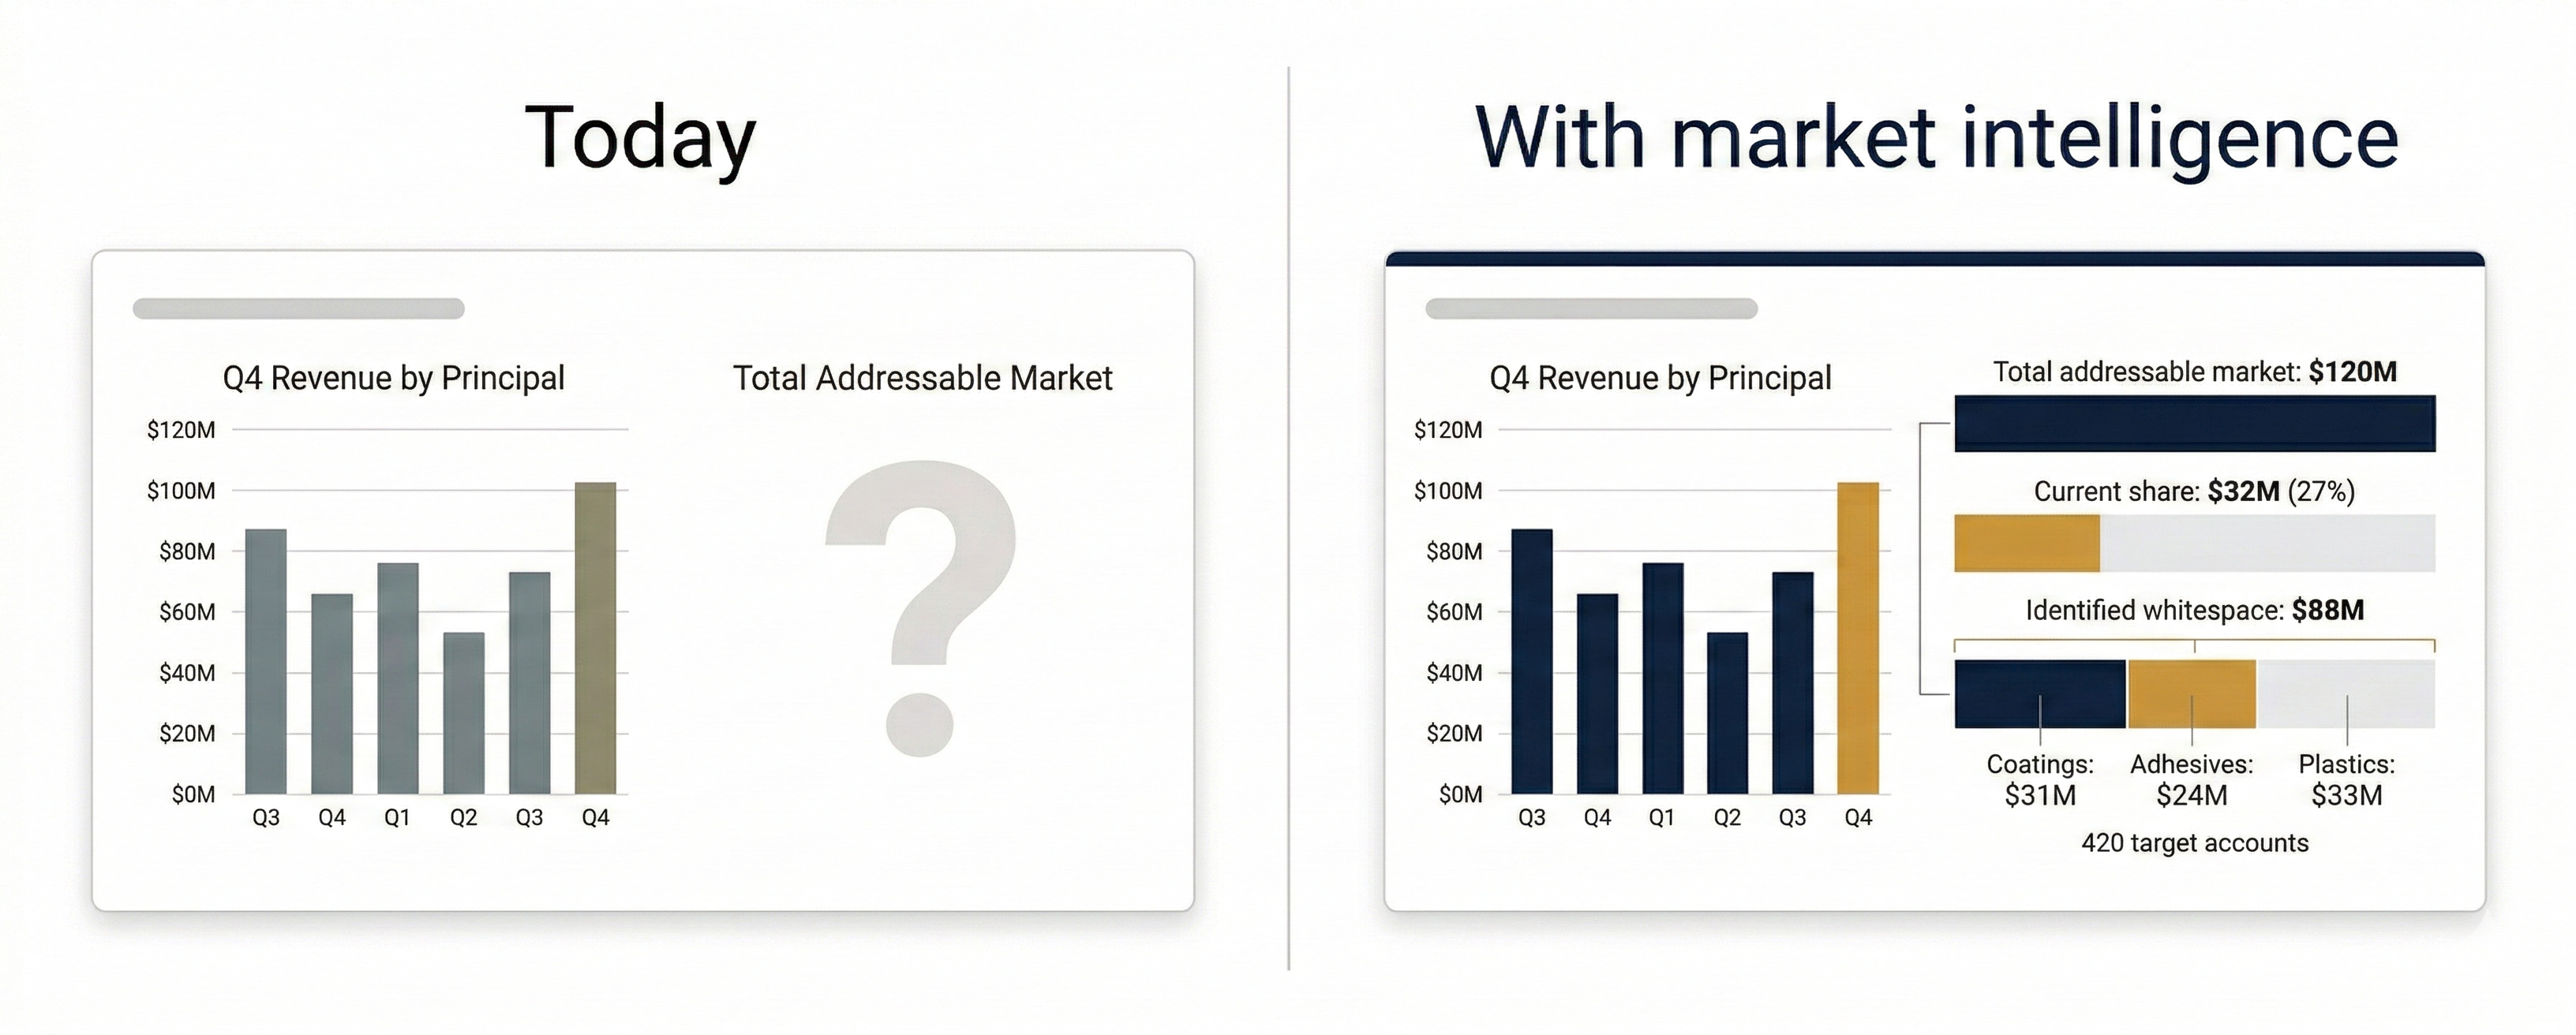
Whether you're defending an existing relationship or pitching a new supplier, the conversation comes down to three data points:
- Total addressable market: How large is the market for this product line in your territory? Not a national figure, but the TAM specific to your geography, your customer segments, and your end markets.
- Current market share: What percentage of that TAM flows through you today? Which accounts are buying, and how much wallet share do you hold in each?
- The whitespace: What's the gap between those two numbers, broken down by account, industry, and region?
These are the numbers principals use to decide whether to deepen a relationship, renew an agreement, or take a meeting with you in the first place. Without them, you're asking suppliers to take your word for it. Your competitors who show up with data won't have that problem.
Why you still can't produce them
It's not because you haven't tried. The data you'd need to size a market for a single principal lives across too many systems in too many formats.
Your ERP knows what you sold. Your CRM knows who you're talking to. Neither one knows what you could be selling. Product data carries 40 to 60 attributes per SKU, scattered across TDS/SDS documents with no standardized taxonomy across suppliers. One principal's "precipitated calcium carbonate" maps to another's "PCC functional filler." Reconciling that across your full portfolio is a manual exercise that nobody has time for.
And then there's the knowledge that lives in your reps' heads. Your best salespeople know which accounts are underserved, which industries are growing, and which competitors are vulnerable. None of that is captured in a system that can be aggregated or analyzed at the portfolio level.
Assembling a credible TAM analysis for one principal takes weeks of analyst time. Most distributors don't have dedicated market analysts on staff. The work falls to sales leaders who are already stretched thin. Doing it across your full supplier portfolio with manual processes isn't realistic. So the work doesn't get done, and the blind spot persists.
What it costs you
With existing principals: Your QBRs become revenue recaps. You report what happened last quarter instead of presenting where the growth is. When it's time for your principal to decide whether to renew or diversify their distribution, you don't have the data to make your case. Cross-sell opportunities stay buried because nobody has mapped product overlap against the customer base. You might have hundreds of accounts that could buy a principal's adjacent product line, but your reps never make the connection because the data isn't in front of them.
With new suppliers: You can't make a quantified pitch. "We have strong relationships in the Southeast" isn't a business case. "We serve 300 accounts across your top three end markets and see $4M in addressable whitespace" is. The distributors winning new principal agreements are the ones showing up with that second version. If you can't size the opportunity for a prospective supplier, someone else will.
Closing the gap
The fix is treating principal management as a market intelligence problem, not just a relationship one. That means combining your ERP transaction data with external market intelligence and customer industry data, then mapping your customer base against each principal's product portfolio to identify the whitespace.
In practice, this looks like three steps. First, connect your transaction history to market data so you can calculate penetration rates by product, by region, and by end market. Second, map your existing customer base against each principal's portfolio to find where you're already serving accounts that should be buying but aren't. Third, identify net new accounts in your territory that match the profile of your best customers for a given principal's products.
AI makes this possible at scale. Matching manufacturers to product applications, finding look-alike accounts, estimating wallet share across hundreds of customers and dozens of principals. That's the kind of cross-referencing that used to take an analyst weeks per supplier. It doesn't have to anymore.
The result: you walk into every QBR and every new supplier pitch with the three numbers that matter. That's the difference between asking a principal to trust you and showing them the opportunity.
See how Corvus helps distributors quantify market potential across their entire supplier portfolio.
See Corvus in action
See how Corvus helps distributors turn principal management into a data-backed growth strategy.
Book a Demo